 English (UK)
  Русский (РФ)
 Experimental data obtained at spectrometer Thermo Fisher Scientific Escalab 250Xi for demonstration of standard methods of investigations and checking of technical parameters of the setup
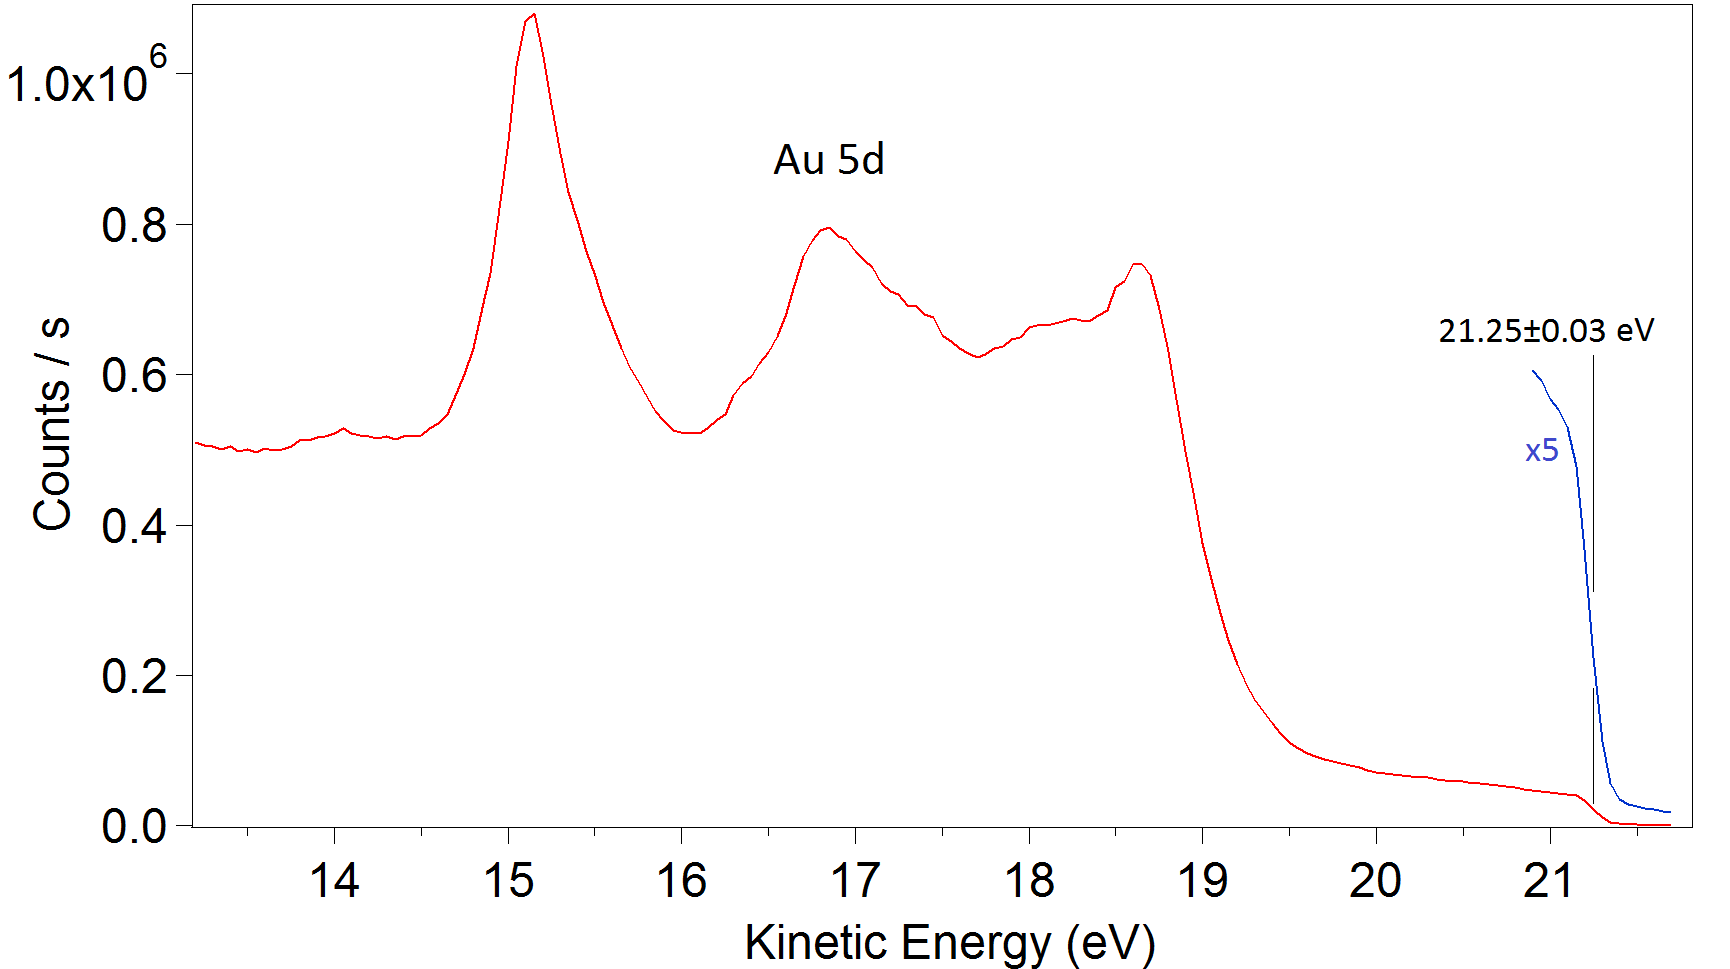
Photoelectron spectra of valence band of polycrystalline gold. HeI (E=21.2 eV). Epass=1 eV. Step=0.05 eV (near Fermi level - Epass=2 eV)
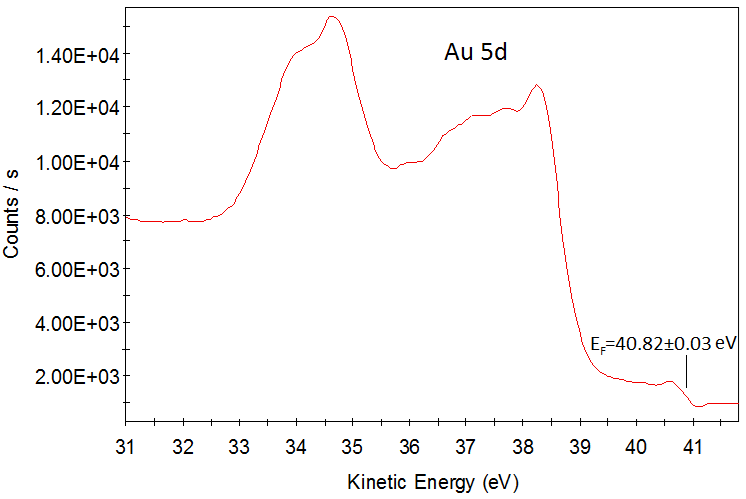
Photoelectron spectra of valence band of polycrystalline gold. HeII (E=40.8 eV). Epass=5 eV. Step=0.05 eV.
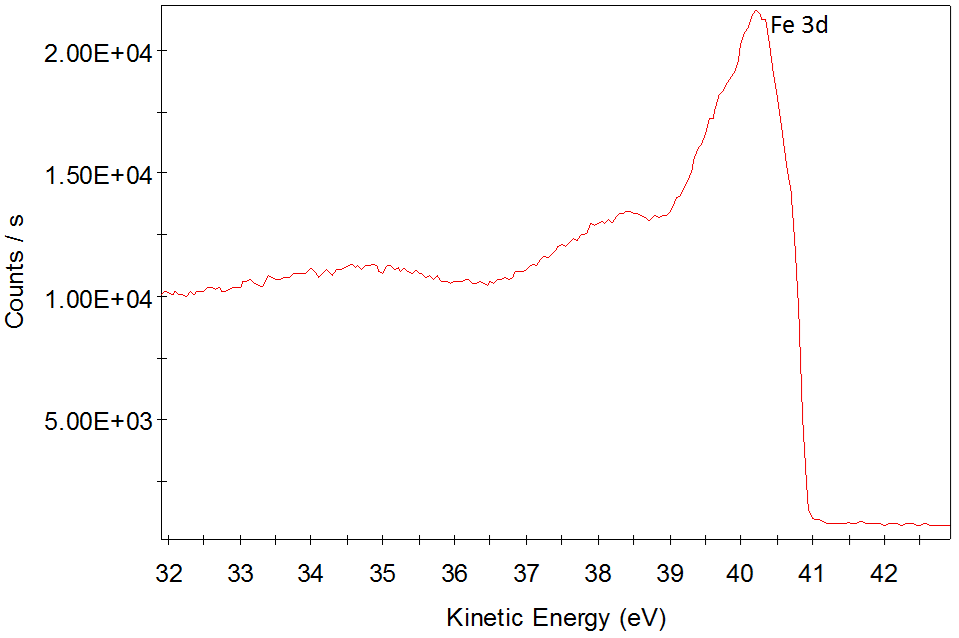
Valence band of α-iron. HeII (E=40.8 eV). Epass=5 eV. Step=0.05 eV.
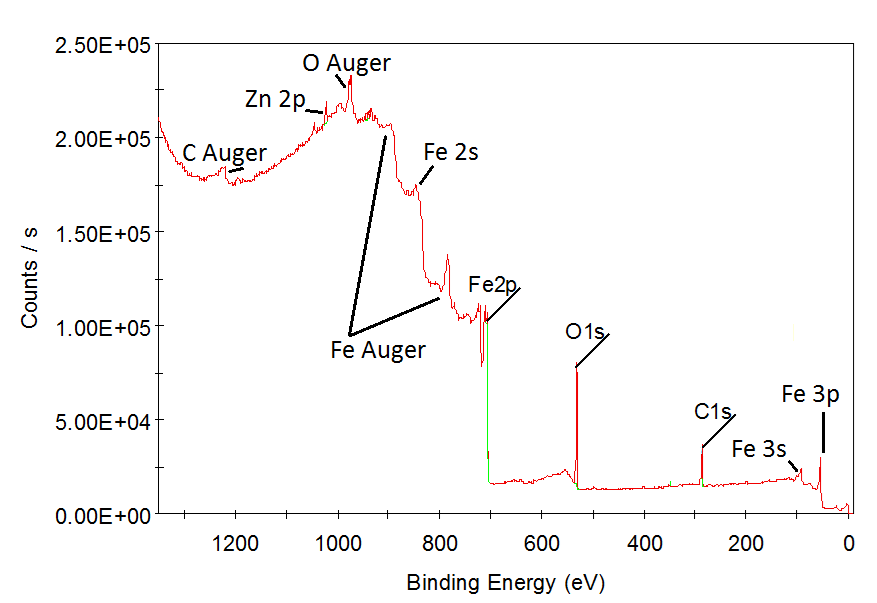
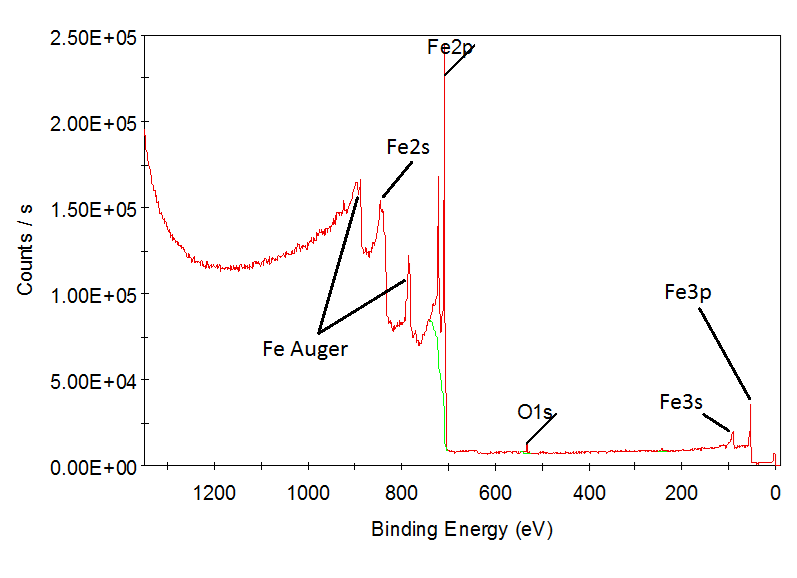
Investigation of electron structure of core levels. Determination of chemical compositon. Cleaning of the surface.
|
|
|
|||||||||||||||||||||||||||||
|
|
|||||||||||||||||||||||||||||
|
||||||||||||||||||||||||||||||
Results show that equipment allow: a) identify chemical composition with high sensivity; b) make effective etching of the surface.
Determination of spectrometer energy resolution
XPS of silver 3d. Epass=5 eV. Step=0.05 eV.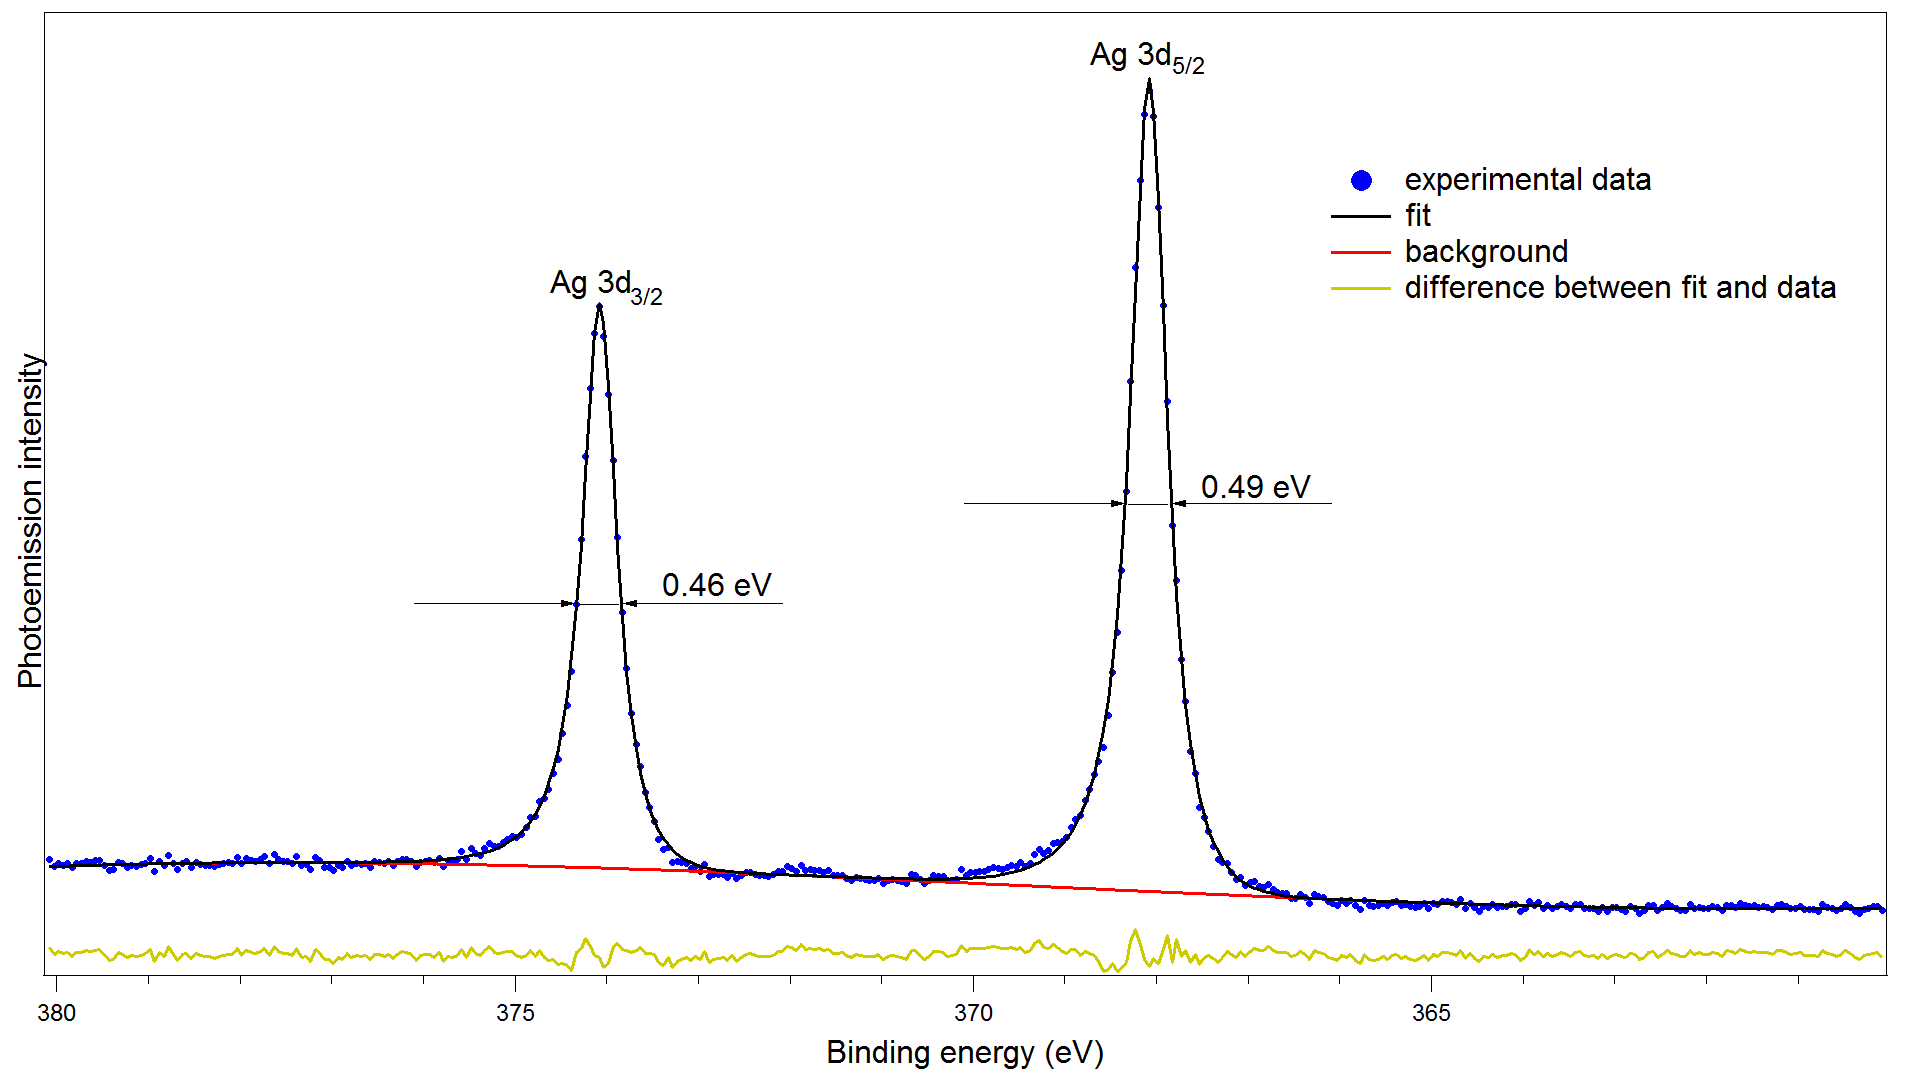
FWHM of peak Ag 3d3/2 is 0.46 eV, FWHM of peak Ag 3d5/2 is 0.49 eV.
XPS of polycrystalline gold 4f. Epass=5 eV. Step=0.05 eV.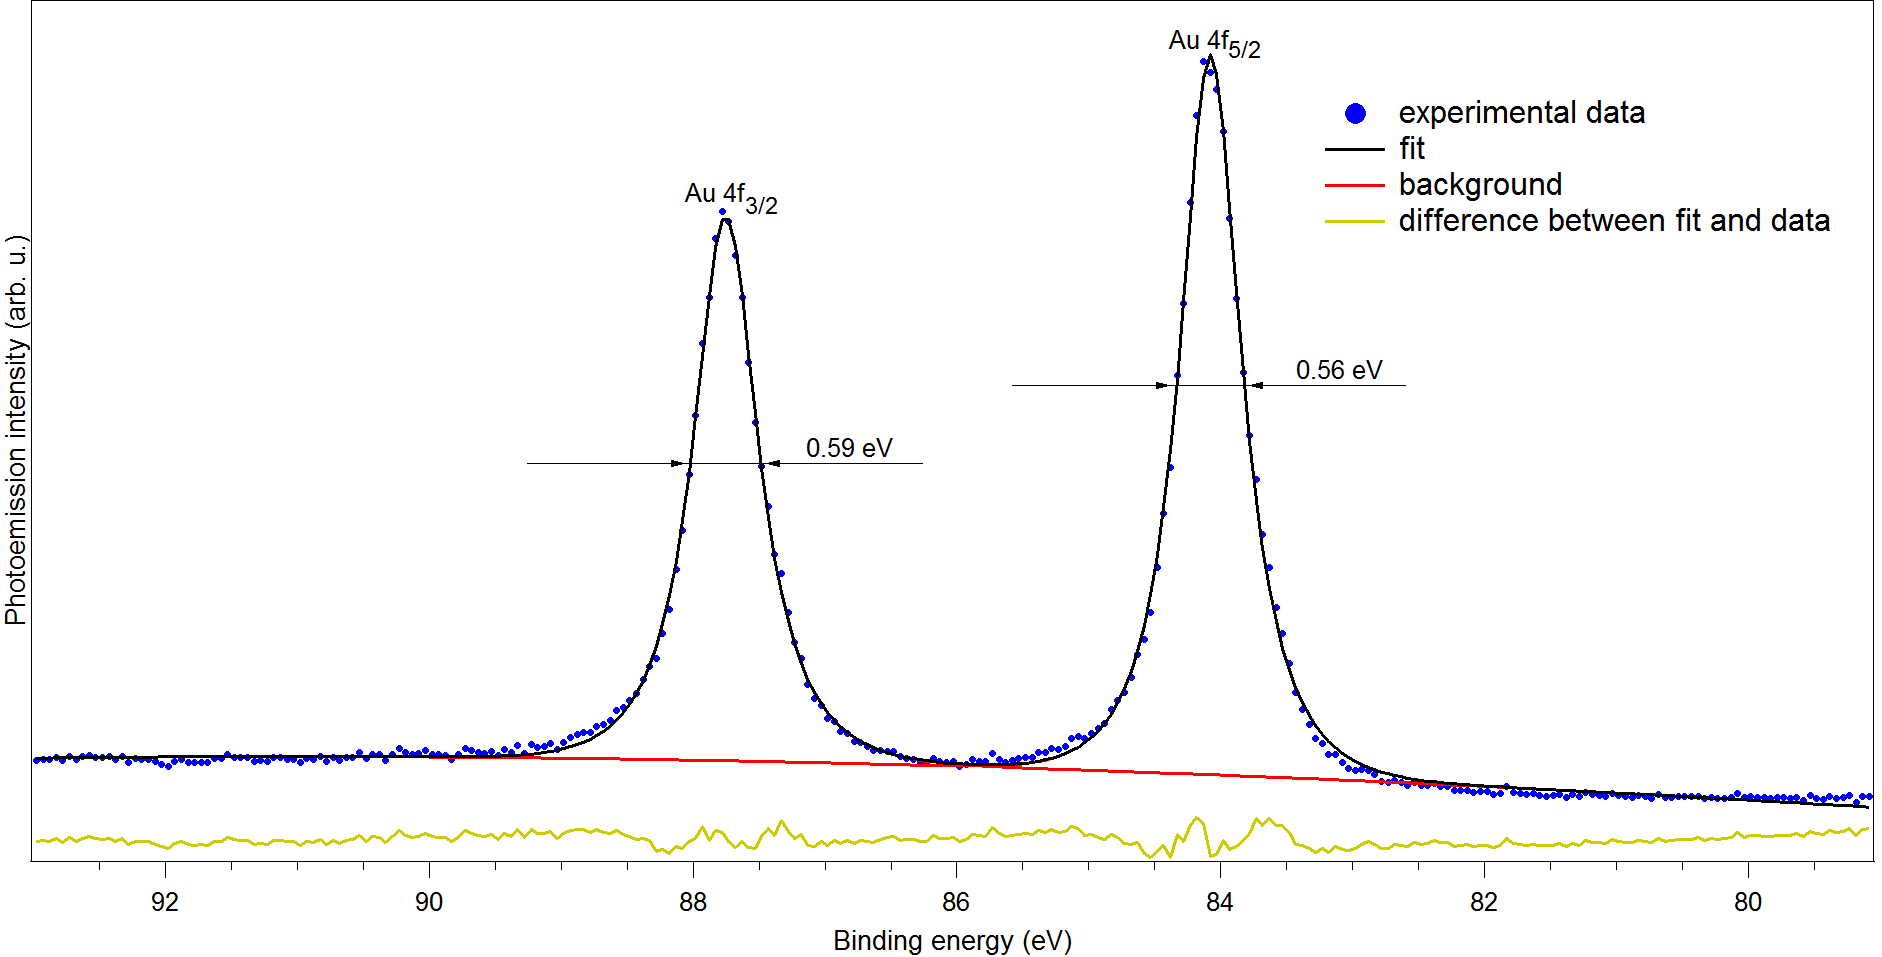
FWHM of peak Au 4f7/2 is 0.56 eV.
Valence band of highly oriented pyrolytic graphite (HOPG). HeI (E=21.2 eV). Epass=1 eV. Step=0.05 eV.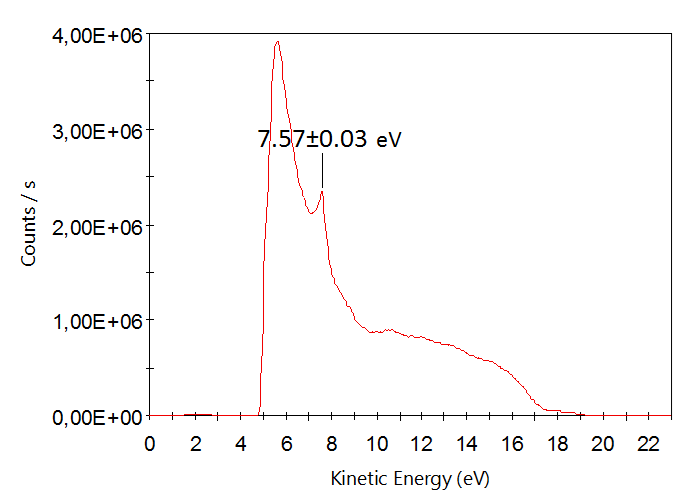
Peak has energy 7.57±0.03 eV due to electron excitation from σ-state of graphite in conductivity band. This fact confirms linearity of energy scale [1].
Fit of C1s core level spectrum as an example on nanosystem B–graphene/Ni(111)/W(110).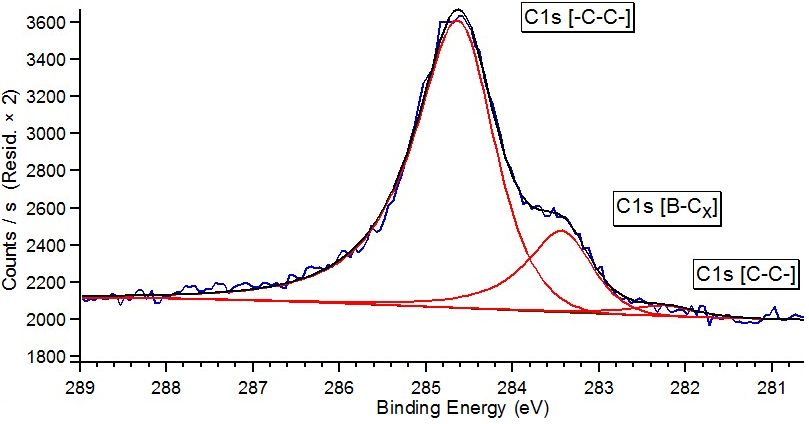
Obtained spectrum gives reason to suppose that atoms of boron are embedded into graphene lattice and have 2 atoms of carbon in the nearest environment for the used method of sample synthesys. The most probable bond determined by stoichiometric analysis confirms data obtained by modelling [2].